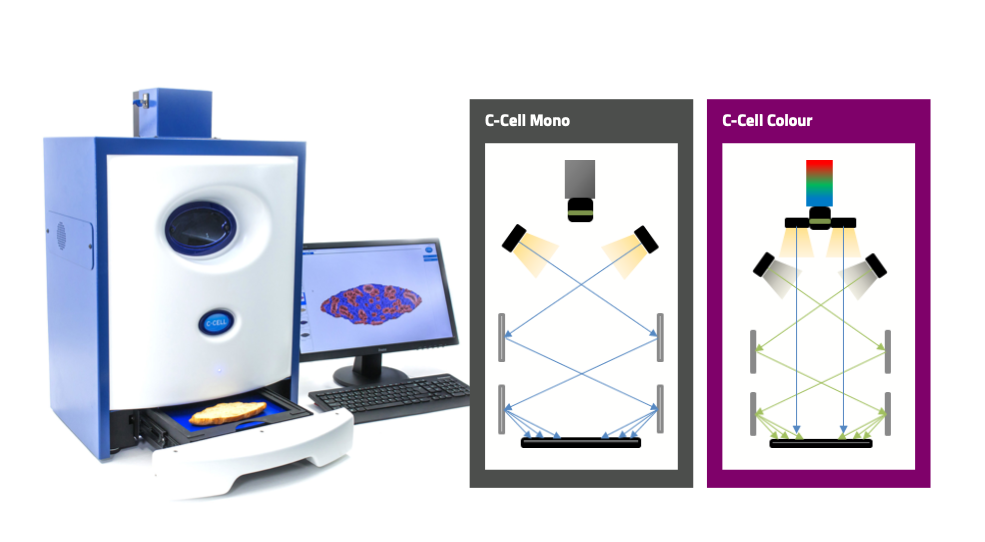
C-Cell measures the structural characteristics of bread and baked goods objectively.
This is a method of analysis that is based on digital imaging, providing comprehensive data from multiple parameters.
But how do you interpret the analysis that C-Cell provides?
How C-Cell Measures Samples
C-Cell uses precision-controlled illumination and high resolution image-capture for consistent, high quality analysis of samples.
Dedicated software supports this technology, processing detailed data for analysis. It can measure up to 65 different parameters that relate to the quality of the product you are analysing.
Broadly, analysis covers these categories:
External Dimensions
Shape
Cell Size & Distribution
Cell Elongation
Crumb & Crust Colour
Optional Items include:
Inclusions
External features
Bread Score
Colour analysis of crust and crumb uses the L*a*b* format.
Colour correlation in the monochrome model use the 256 greyscale to quantify brightness and cell contrast which produces a value that combines information about the background colour of the flour and the size and shape of the cellular structure.
Measurement of dimensions and shape includes the overall area, maximum height, width and circumference of each sample slice. Analysis of sample slice dimensions also provides data for concavity, oven spring, and top shoulder and bottom roundness.
Analysis of individual cells contributes to overall details about the number, size and distribution of cells along with the average cell wall thickness in the sample. This analysis also quantifies holes using standard deviation measurements on the cell size distribution histogram.
X-Y diameter co-ordinates for each cell enable measurement of cell elongation. The C-Cell software provides a circulation map, which shows the axis of elongation and the internal crumb structure’s level of curvature.
Using L*a*b* value differences we can separate inclusions such as red cherries from the background crumb colour. Once identified we can quantify number, area and exact location within the slice.
L*a*b* values can also be used measure a sample product’s external features, such as sesame seeds on the top of a burger bun or surface cracking on cookies, and will determine the degree to which there is uniformity of distribution of these features.
C-Cell Colour can produce a bread score for each sample it analyses. This is a product-specific algorithm that will correlate with the specific producer’s own subjective scoring regime.
Note: C-Cell Colour has expanded colour separation capabilities due to incorporating a three chip colour camera, whereas C-Cell Mono uses a monochrome camera covering all none colour related measurement characteristics such as: External Dimensions / Shape / Cell size & distribution / Cell elongation
Interpreting the Data
Data analysis is accessible and easy to read and interpret using C-Cell.
There are user options for displaying data in ways that are most appropriate for each type of sample. C-Cell stores all its data sets in a secure database.
The system’s core functions determine its results:
The technology ensures optimum image quality, analysing the sample in a single, rapid operation
Data, including images, is objective, reproducible and users can easily share it with others
The system uses various types of data analysis to evaluate the product sample, and users can identify the most relevant subsets to match their testing objectives
Cell data includes cell numbers, cell area, and cell structure, including holes and wall thickness
C-Cell displays the basic dimensions of the sample, and also measures area, height, concavity and oven spring
Brightness and contrast settings give additional information about crumb and structure.
C-Cell data is easily accessible for re-analysis from the database that stores it, and there are optional formats for this data storage, including standard reporting CSV or Excel spreadsheets.
The main benefits of C-Cell are that it saves time with rapid, accurate analysis in just five seconds. From this analysis, it provides objective, actionable data that is easy to access and interpret.
Depending on the style of baked product being analysed the user can identify key parameters that relate to the production process and allow the baker to make changes to the process or even formulation to enhance quality
For more information, please contact C-Cell.


